Audio Reactive LED Strips Are Diabolically Hard
In 2016, I bought an LED strip and decided to make it react to music in real time. I figured it would take a few weeks, but it ended up being a rabbit hole. Ten years later, the project has 2.8k GitHub stars, has been covered by Hackaday, and is one of the most popular LED strip visualizer projects available. People have built it into nightclubs, integrated it with Amazon Alexa, and used it as their first electronics project.
I'm still not satisfied with it.
Volume Is Easy
I started with non-addressable LED strips where I could control the brightness of the red, green, and blue color channels independently, but not the individual LED pixels. I tried the most obvious thing first: read the audio signal, measure the volume, and make the LEDs brighter when it's louder. These were all relatively straightforward time domain processing methods. Read a short chunk of audio around 10-50ms in duration, low pass filter it, map the intensity to brightness.
I assigned each color channel to a different time constant to get a kind of color effect. One color would respond rapidly to changes in volume, one would respond slowly, and one in the middle. You can get something like this working in an afternoon and it looks okay on an LED strip or a lamp with a single RGB LED.
It gets boring fast. All the interesting frequency information is lost and it works best on punchy electronic music. It is terrible on many other kinds of music where volume is not the most interesting feature. There is no understanding of what kind of sound the system is reacting to, just how loud it is.
I also had to implement adaptive gain control almost immediately. If you set a fixed volume threshold, the visualizer either saturates in a loud room or barely flickers in a quiet one. My favorite way to do this was with exponential smoothing a simple and effective filter that I used over and over in various parts of the code.
Although the time domain visualizer was okay, I found the limited output channels made the result unsatisfying. There is only so much information you can display on three color channels. Eventually, I switched to WS2812 addressable LEDs so that I'd have many more output features to work with.
The Naive FFT
The obvious next step was to use frequency domain methods. Collect a short chunk of audio, compute a Fourier transform (a mathematical tool that breaks audio into its individual frequencies), get frequency bins, and map them to LEDs. I had 144 pixels on a one meter strip, so I thought, 144 bins, one per LED. Then render the spectrum.
It kind of worked. I could tell right away that more of the audio was being captured compared to the volume method. But the result was deeply unsatisfying. Almost all of the energy was concentrated in a handful of LEDs, and most of the strip was dark.
I tried cropping the frequency range to use more of the strip. It helped a little, but I still felt that many of the LEDs were underutilized and that the FFT method was lopsided. I struggled with this for a long time.
Most people who attempt audio reactive LED strips end up somewhere around here, with a naive FFT method. It works well enough on a screen, where you have millions of pixels and can display a full spectrogram with plenty of room for detail. But on 144 LEDs, the limitations are brutal. On an LED strip, you can't afford to "waste" any pixels and the features you display need to be more perceptually meaningful.
Pixel Poverty
Pixel Poverty, Feature Famine, Compression Curse, whatever you want to call it, is the central lesson I learned and the reason LED strip visualization is so difficult. You might think that LED strips are simpler than screen-based visualizers, but the opposite is true. A screen-based visualizer has millions of pixels to work with, but an LED strip has hundreds at most. You can compute tons of audio features and display them all on the screen, and if most of them are uninteresting, it doesn't matter. As long as some of the features resonate with what a human perceives as interesting, the visualization works. On an LED strip, you have to be right about which features are worth displaying.
An LED strip is pixel-poor. A one meter strip might have 144 LEDs. That's it, and there's nowhere to hide. Nearly every single pixel has to be doing something that a human perceives as musically relevant. The margin for error is incredibly narrow.
This is what makes LED strip visualizers fundamentally harder than screen-based ones. I couldn't just display raw signal processing data. I had to understand how humans actually perceive music and build a perceptual model into the pipeline.
The Mel Scale
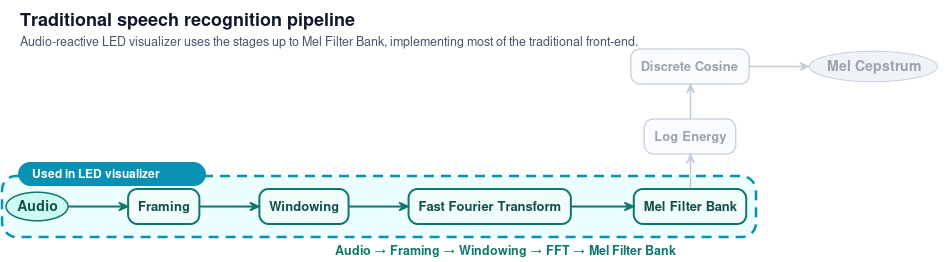
I started reading papers from the speech recognition field to understand how their signal processing pipelines worked. Speech recognition has spent decades figuring out how to extract features from audio that match human perception, because if you can't model what a human hears, you can't transcribe what they said, and that's where I found the mel scale.
Humans don't perceive pitch linearly. The perceptual distance between 200Hz and 400Hz feels much larger than the distance between 8000Hz and 8200Hz, even though both spans are 200Hz. Our brains are heavily tuned to the speech band between roughly 300Hz and 3000Hz, and much less interested in frequencies far outside that range.
The mel scale transforms frequencies from Hz into a perceptual space where pitches are equally distant to a human listener. Instead of mapping raw FFT bins to pixels, which spreads the perceptually important frequencies across only a few LEDs, I mapped mel-scaled bins to pixels.
The difference was night and day. The entire strip lit up. Every LED was doing something meaningful. That was the breakthrough. Everything else built on top of it.
What I realized is that the audio LED visualizer uses much of the same frontend as a traditional speech recognition pipeline. The mel filterbank, which speech systems use to extract perceptually relevant features before feeding them into a recognizer, is exactly what makes the LED strip come alive. I take the output of the mel filterbank and feed it directly into the three visualizations.
Smoothing, Flickering, and Convolutions
The mel scale solved the frequency mapping problem, but the raw output still flickered badly. Features changed too rapidly and the strip looked jittery and unpleasant. I needed the visualization to feel smooth and intentional, not noisy.
I applied exponential smoothing on a per-frequency-bin level, so each frame blends with the previous one. Features change gradually instead of jumping around. This eliminated the flicker without adding perceptible latency.
Then I discovered that convolutions (a mathematical operation that blends neighboring values together) were perfect for spatial smoothing. LED strips are 1D vectors, which makes them an ideal substrate for convolution operations. In university I learned the math of convolutions but the applications felt abstract. On the LED strip, it finally clicked. Different kernels gave me different effects: a narrow kernel for a max-like operation on adjacent pixels, wider kernels for gaussian blur. I could smooth the spectrum, soften transitions, and control how features blended spatially. I still think about convolutions in terms of LED strips today.
Both Sides of Perception
At this point I realized the visualizer needs perceptual models on both sides of the pipeline. On the input side, the mel scale models how humans perceive sound. On the output side, I needed to model how humans perceive light.
We don't perceive brightness linearly either. A raw linear mapping of audio energy to LED brightness looks wrong because our eyes have a logarithmic response. This led me into gamma correction (adjusting brightness values to match how our eyes actually perceive light) and color theory: RGB, HSV, LAB, sRGB, complementary colors. I learned that mapping frequency content to color is its own rabbit hole, and that getting the color palette right makes a surprising difference in how "musical" the visualization feels.
Three Effects
I ended up with three visualizations. Spectrum renders the mel-scaled frequency content directly, one LED per perceptual frequency band. Scroll creates a time-scrolling energy wave that originates from the center and scrolls outward, with frequency content mapped to color. Energy pulses outward from the center with increasing sound energy. I wish there were more, but these three work well together.
The Latency Tradeoff
All of this has to work in real time, with no knowledge of what comes next. Longer audio chunks give you higher quality frequency data but add lag. Shorter chunks are fast and responsive but noisy. I ended up using a rolling window that overlaps successive chunks, which gives you better frequency resolution without adding much lag. Finding the right window size took a lot of tweaking.
The Architecture
The project supports two main platforms. On a Raspberry Pi, the Pi handles both audio processing and LED rendering via GPIO. On an ESP8266, the audio processing runs on a PC in Python, and pixel data is streamed to the microcontroller in real time. The whole project is freely available at github.com/scottlawsonbc/audio-reactive-led-strip.
A Life of Its Own
The first version of this project was installed in the Engineering Physics clubhouse at UBC. We used it at parties. It was crude, but people liked it. To reduce the glare from bare LEDs, I hand-crafted diffusers from paper sheets taped into tubes over the strip, giving a softer, more diffuse glow.
After I graduated, I had a bit of time and spent a few weeks polishing the code, writing thorough documentation, and finishing up the project before putting it on GitHub.
It took off in a way I never expected. The project was covered by Hackaday in January 2017 and became popular on Reddit. As of today it has over 2,800 stars and 640 forks on GitHub. It's been used by thousands of people.
One of the first people to try the project was Joey Babcock. He reached out early on and eventually submitted a pull request. I remembered reading a blog post years earlier called The Pull Request Hack, where the central idea was: whenever someone sends you a pull request, give them commit access to your project. I thought, what the heck, I'll try it. So I gave Joey commit access. He became the first maintainer of the project other than me, and I am forever thankful for his efforts responding to issues and keeping the project alive. I couldn't believe the advice actually worked so well.
People started sending me videos of what they built. Richard Birkby integrated the project with his Amazon Echo. In his video, he says "Alexa, tell kitchen lights to show energy" and his room lights up. I was blown away that people were taking my project and using it in ways I had never expected.
Another user who does AV at a club sent me a video of the strip in action during a DJ night, with dozens of people dancing in front of a live band. He wrote: "people were very happy... If they only knew this was the 6th Raspberry Pi doing stuff in the bar around them." The LED strip was mounted above the stage for everyone to see, lighting up in real time as the band played.
A developer in China forked the project, added ESP32 and Home Assistant support, wrote Chinese documentation, and built a custom microphone shield PCB to make setup easier. Someone made a YouTube video about the project because they felt it deserved more recognition. People around the world submitted pull requests adding beat detection, new effects, and code improvements.
The most rewarding part was learning that people used this as their first electronics project. Someone who had never soldered before bought an LED strip and a Raspberry Pi, followed the documentation, and got it working.
It's the only project I've worked on that took on a life of its own.
What's Still Missing
When a human manually codes an animation sequence for a specific song, the result is dazzling. Every beat and drop is perfectly timed. That hand-coded result is the gold standard, and automatic visualization is still far from it.
The biggest unsolved problem is making it work well on all kinds of music. The visualizer works best on punchy electronic music with clear beats and strong contrast. Vocal-heavy music, jazz, classical piano, guitar, violin all have different frequency and time domain characteristics. One piece of code can't perform well on all of them. They call for different approaches.
The other thing I want to crack is capturing that essential quality of music that makes a human tap their foot. When you listen to a song, you feel something and your body wants to move. Writing code that mimics that response would make the visualizer dramatically better. I haven't figured out how to do it reliably in real time.
I think the future of audio visualization on LED strips will involve a mixture of experts tuned for different genres, likely using neural networks. I have this idea of generating a training dataset by listening to music while holding an accelerometer, and using the relationship between the audio signal and my body's physical response to train an AI-based visualizer. I haven't done it yet. I have lots of ideas and not enough time.
What I Learned
I started this as a fun LED project. I ended up spending years learning how humans perceive pitch, how to smooth noisy signals, how our eyes respond to brightness, and the difficulty of mapping sound onto light through a pixel-poor bottleneck.
Every commercial audio reactive LED strip I've seen does this badly. They use simple volume detection or naive FFTs and call it a day. They don't model human perception on either side, which is why they all look the same.
When the mel scale is tuned and the filters are dialed in and the colors map to the right frequency bands, the strip comes alive. You put on a song and the LEDs feel like they understand the music. People sent me videos from nightclubs on the other side of the world.
It's the hardest thing I've built, and I'm still not done with it.